Partix Auto
Understanding what is the role of damping in vehicles begins with a simple observation: a car must control motion after every bump, brake application, and steering input. Damping converts suspension movement into heat through shock absorbers. This process helps keep the tire connected to the road, rather than allowing repeated bouncing. On a wet corner, that contact can influence braking confidence and steering accuracy. In practical testing, technicians often compare rebound control, compression control, tire wear, and body movement on a chassis dynamometer.
It is not merely a comfort feature. Damping affects ride quality, pitch control, roll behavior, braking stability, and electronic stability-control performance. ISO 2631-1 provides guidance for evaluating whole-body vibration, which helps engineers assess how suspension movement reaches occupants. SAE suspension-testing practices also encourage repeatable measurements instead of relying only on subjective impressions. Meanwhile, NHTSA’s Traffic Safety Facts reports show how vehicle control and road conditions remain central safety concerns, although national crash reports rarely isolate damper performance as a single cause.
That limitation matters. A worn damper may not fail dramatically; it may slowly increase stopping distance over uneven pavement, reduce nighttime confidence, or make a loaded vehicle feel nervous. Small changes become visible.
Industry guidance from manufacturers, ZF Aftermarket technical materials, and TÜV-oriented inspection practices generally supports checking leakage, uneven tire wear, and excessive rebound. Still, replacement advice is not universal. Vehicle weight, tire design, road quality, payload, and driving style all change the result. The most reliable understanding combines measured data, inspection experience, and cautious interpretation. Damping is essential, but it is only one part of the vehicle’s larger safety system.
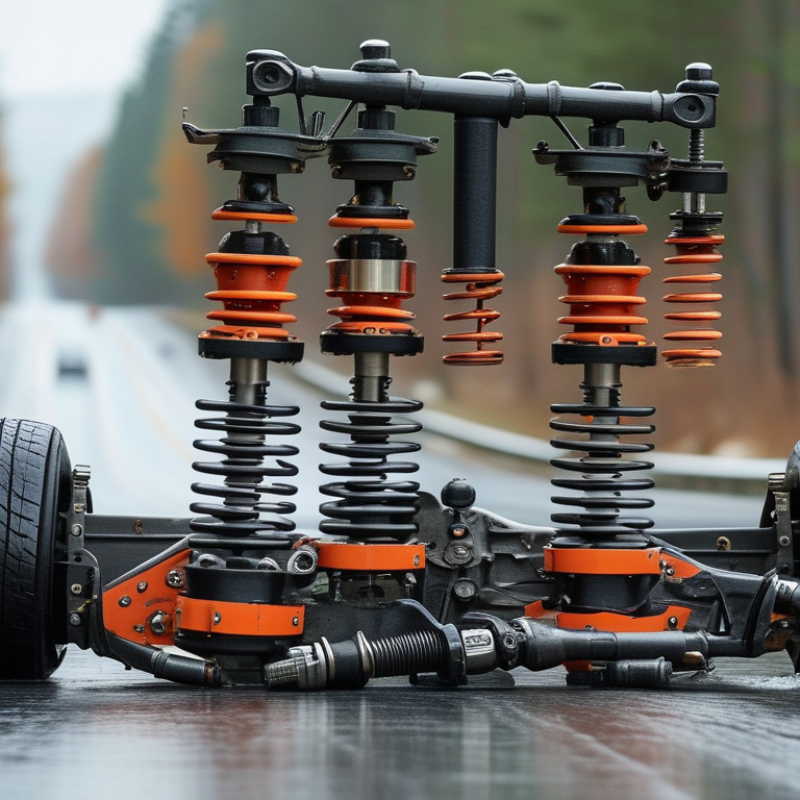
Vehicle damping controls how quickly suspension motion loses energy. A damper creates force against piston velocity, not simply against displacement. During a sharp bump, the wheel moves upward, increasing compression velocity and generating resistance. When the wheel returns, rebound force controls the spring’s stored energy. This force–velocity relationship strongly affects tire contact, body motion, and passenger comfort.
A useful model is F = cV , where force rises with velocity. However, real dampers rarely behave perfectly linearly. Their force may increase sharply at low speeds, then change slope at higher speeds. Compression and rebound can also produce different curves. Temperature matters too. After repeated movement, warmer fluid may reduce resistance, changing the vehicle’s response. Small details matter.
Energy dissipation can be viewed through power: P = F × V . Every moment of opposing force removes kinetic energy from the suspension system. Across a full compression and rebound cycle, the force–displacement loop represents the energy converted mainly into heat. Test engineers measure these curves on a dynamometer, then compare them with road sensations. A clean graph does not always predict a perfect ride. I have found that a setting appearing efficient in testing can still feel harsh over repeated square-edged bumps. The model is valuable, but it deserves questioning.
Damping controls how quickly a vehicle settles after a bump, braking event, or steering input. Engineers often use the damping ratio, ζ, to compare suspension behavior. SAE vehicle-dynamics literature commonly treats ζ≈0.2–0.4 as a practical range for passenger vehicles. Lower values feel soft but may create repeated body motion. Higher values settle the body faster, yet can transmit sharper impacts.
For a quarter-car model, ζ equals c divided by critical damping, 2√(km). Consider a 375 kg sprung mass and a 25,000 N/m spring rate. Critical damping is approximately 6,124 N·s/m. The ζ≈0.2–0.4 range therefore gives about 1,225–2,450 N·s/m. That is a useful design window, not a universal answer.
ISO 2631-1:1997 links measured vibration exposure with human comfort, while ISO 8608:2016 describes road roughness using spatial power spectral density.
Test data should include different speeds, loads, and road surfaces. A damper that feels controlled on smooth asphalt may feel harsh over short, sharp edges. SAE road-load measurement practices also show why input quality matters during testing. Real suspensions add tire compliance, bushings, friction, and nonlinear damping. My first calculation may look precise, but it can still miss these effects. ζ is a starting point, not the final verdict.
Across the 1–2 Hz band, the vehicle body usually becomes the main moving mass. This range often contains bounce and pitch modes. The springs set their natural frequency, while dampers control how quickly motion fades.
The basic relationship is clear:
natural frequency equals 1/(2π) multiplied by the square root of stiffness divided by mass.
A heavier vehicle can therefore feel softer with the same spring rate.
The tires operate differently. Their vertical stiffness creates wheel-hop modes, commonly well above 1–2 Hz, while the tire sidewalls filter sharp road inputs. Between these systems, suspension dampers shape the body response. Too little damping allows repeated heave after a bump. Too much damping can transmit impact energy into the cabin.
ISO 2631-1 identifies low-frequency vertical vibration as important for whole-body comfort assessment. SAE J670 also separates bounce, pitch, and wheel movement as distinct vehicle dynamics modes. These standards help engineers map measured acceleration against physical motion, not only subjective impressions.
Tips: Measure body acceleration near the seat rail, wheel acceleration near the hub, and damper velocity at the piston. Plot them across 1–2 Hz first. Look for peaks, phase delay, and decay time. A practical test might show a 1.3 Hz body peak, yet tire pressure, payload, and bushing friction can shift it. The map is useful, but never perfect. Real roads remain irregular, and laboratory settings can hide that weakness.
Vehicle damping is often discussed as a spring-control problem. ISO 2631-1 shifts attention toward human exposure. In a road test, measure whole-body vibration at the seat, floor, and backrest. Record three axes, vehicle speed, road surface, posture, and exposure time. These details matter because the same suspension can feel calm on asphalt and harsh on broken pavement. Short sentence.
Use frequency-weighted RMS acceleration, aw, as a central indicator for regular vibration. Calculate vibration dose value when shocks or jolts dominate. ISO 2631-1 also applies multiplying factors to different axes, so vertical, fore-aft, and lateral motion are not treated equally.
Compare results with comfort guidance carefully. Thresholds are not personal guarantees. They describe likely reactions across groups, not every driver.
A practical engineer should pair numbers with comments: seat pressure, head movement, foot bracing, and fatigue after a fixed route.
During one evaluation, a low RMS result looked promising. Yet testers reported sharp impacts at bridge joints. The average hid brief peaks. We revised route selection and added VDV analysis. That correction improved confidence, but it exposed a weakness in our first method. Damping should therefore be tuned against measured exposure, not isolated suspension motion. Repeat tests with warm and cold conditions, different loads, and consistent seating positions. Keep the raw signals. They reveal errors that a polished score can conceal.
Damping controls how quickly a vehicle’s springs move after a bump. In workshop testing, I compare dampers on the same dyno, temperature, and test speed. At 0.3 m/s, a typical twin-tube damper may produce 1,100 N in compression and 1,600 N in rebound. It usually offers a comfortable ride and reasonable cost. However, repeated rough-road impacts can increase oil temperature and soften its response.
A monotube design often shows higher consistency. Under the same test conditions, it may reach about 1,450 N compression and 2,100 N rebound. Its larger working piston improves heat transfer and response during fast cornering. The trade-off is greater sensitivity to manufacturing accuracy and road impact noise. I have noticed sharper body control, but the ride can feel busy on broken pavement.
Semi-active dampers change their force electronically, often within 10 to 20 milliseconds. During a lane change, they can increase rebound control and reduce body roll. On small bumps, they can soften the response before passengers feel a harsh strike. Their results depend heavily on sensors, software, and calibration. A poor control map can still feel artificial. Test data can also mislead when tire pressure, payload, or damper temperature changes. Real roads remain less predictable than laboratory graphs.
Compare Twin-Tube, Monotube, and Semi-Active Dampers by Representative Performance Data
The chart compares representative damping coefficients measured at low and high piston velocities. A higher coefficient generally provides stronger resistance to suspension movement, while semi-active dampers can vary their force electronically according to road input, vehicle speed, and body motion. Values are typical engineering reference figures for non-brand passenger-vehicle dampers; actual results vary with damper size, temperature, valve calibration, and test conditions.
: It controls how quickly suspension motion loses energy. The damper resists piston velocity, not displacement alone.
The wheel moves upward, increasing compression velocity. The damper generates resistance against this movement.
Usually not. Force may rise sharply at low speeds and change slope at higher speeds.
Compression controls upward wheel movement. Rebound manages the spring’s stored energy as the wheel returns.
Repeated movement warms the fluid. Warmer fluid can reduce resistance and change vehicle response.
It shows energy converted mainly into heat during a compression and rebound cycle.
Body bounce and pitch modes often occupy this range. The vehicle body is usually the main moving mass.
Tires create higher-frequency wheel-hop modes. Their sidewalls also filter sharp road inputs.
The vehicle may continue bouncing after a bump. Body movement takes longer to settle.
More impact energy may enter the cabin. The ride can feel harsh, especially over repeated sharp edges.
They can measure acceleration near the seat rail, floor, and backrest. Wheel acceleration can be measured near the hub.
A low RMS value may hide brief impacts. Bridge joints can still feel sharp.
It helps when shocks or jolts dominate. RMS alone may not describe those short events well.
Test warm and cold conditions, different loads, road surfaces, speeds, and seating positions.
No. A clean graph may still miss harshness on irregular roads. The model needs questioning.
Understanding what is the role of damping in vehicles begins with examining how suspension dampers control motion through force–velocity behavior. A damper converts suspension movement into heat, reducing oscillation after bumps, braking, cornering, or load changes. Engineers commonly target a damping ratio of approximately ζ ≈ 0.2–0.4, balancing body control with acceptable ride comfort. Within the important 1–2 Hz body-motion range, tires, springs, dampers, and vehicle mass interact to determine how effectively vibrations are isolated and controlled.
Ride evaluation can be supported by the ISO 2631-1 whole-body vibration criteria, which relate measured vibration exposure to perceived comfort and potential fatigue. Performance comparisons among twin-tube, monotube, and semi-active dampers should therefore consider measurable factors such as force curves, heat management, response speed, adjustment range, and consistency over different operating conditions. The most suitable design is not defined by one feature alone, but by how efficiently it manages energy, maintains stability, and delivers a controlled, comfortable response across real-world driving situations.